Bridget Suthersan

Data Scientist working in the not-for-profit sector.
Advanced data analytics and visualisation
View My LinkedIn Profile
Like many soon-to-be parents, my husband and I are currently trying to navigate all the new products we need to buy before the little chap makes his arrival…clothes, wraps, nappy changing tables, you name it. One of the new things we’ll need is a baby bath, as we don’t have a separate bath at our current place.
One baby bath I really liked the look of was this fold-up baby bath. My husband liked it also, but he was also concerned about the baby growing out of it quickly. A short argument ensued, and yada yada yada, I decided to check if there was any hard data out there to check for how long we might realistically expect the bath to last us.
I started by scraping the review data for the bath from Amazon, using a function, ‘amazon_scraper_mod’, that I found online. Data returned by this function included: the title, author and date of the review; numbers of stars; and the actual review text. In total, I was able to use this function to scrape 545 separate reviews of the baby bath, which I assigned to the dataframe mydata.
Next, I unnested the tokens into two words. What I was trying to pick out was if any of the commenters had mentioned how long the baby bath had lasted them in terms of the age of the child. To do this, I first used the stringr function str_detect to filter for two-word terms which ended with either ‘month’ or ‘months’ , and then created a new column duration which contained just the first word or number (aka the duration, in months).
keywords <- mydata %>%
  unnest_tokens(word, comments, token="ngrams", n = 2) %>%
  filter(str_detect(word, "month$|months$")) %>%
  mutate(duration = sub(" .*", "", word))
In total, 199 observations were left in the keywords dataset after undertaking the filtering.
Whilst some commenters had given the duration in numeric terms (“1”), others had given it in string format (e.g. “one”). To deal with this, I created a new dataframe, numberdata, to match the number with its string format.
numberdata <- data.frame(
  duration = c("few", "second","couple", "fifth", "first", "five", "four",
               "six", "three","two","one"),
  time = c(3,2,2,5,1,5,4,6,3,2,1)
)
Next, I merged the two dataframes. In cases where time was left as NA, I replaced with the values in the duration column, most of which were numeric. I then converted timeinto a numeric column, and filtered out any remaining NAs.
keywords <- keywords %>%
  left_join(numberdata, by = 'duration') %>%
  mutate(time = as.character(time)) %>%
  mutate(time = case_when(
    is.na(time) ~ duration,
    TRUE ~ time
  )) %>%
  mutate(time = as.numeric(time)) %>%
  filter(!is.na(time))
After this, I was left with 184 separate observations.
However, I was also concerned about duplicate reviews in the final data, so I again created a separate dataframe to identiy these duplicates and filter them out of the keywords dataframe.
duplicated <- keywords %>%
  group_by(author) %>%
  filter(n()>1)

keywords <- keywords %>%
  filter(!(author %in% duplicated$author))
There were 86 duplicated rows in total, so after all of this, I was left with a data frame of 98 observations. However, with the data in the right format, it was time to graph it and run some basic descriptive stats.
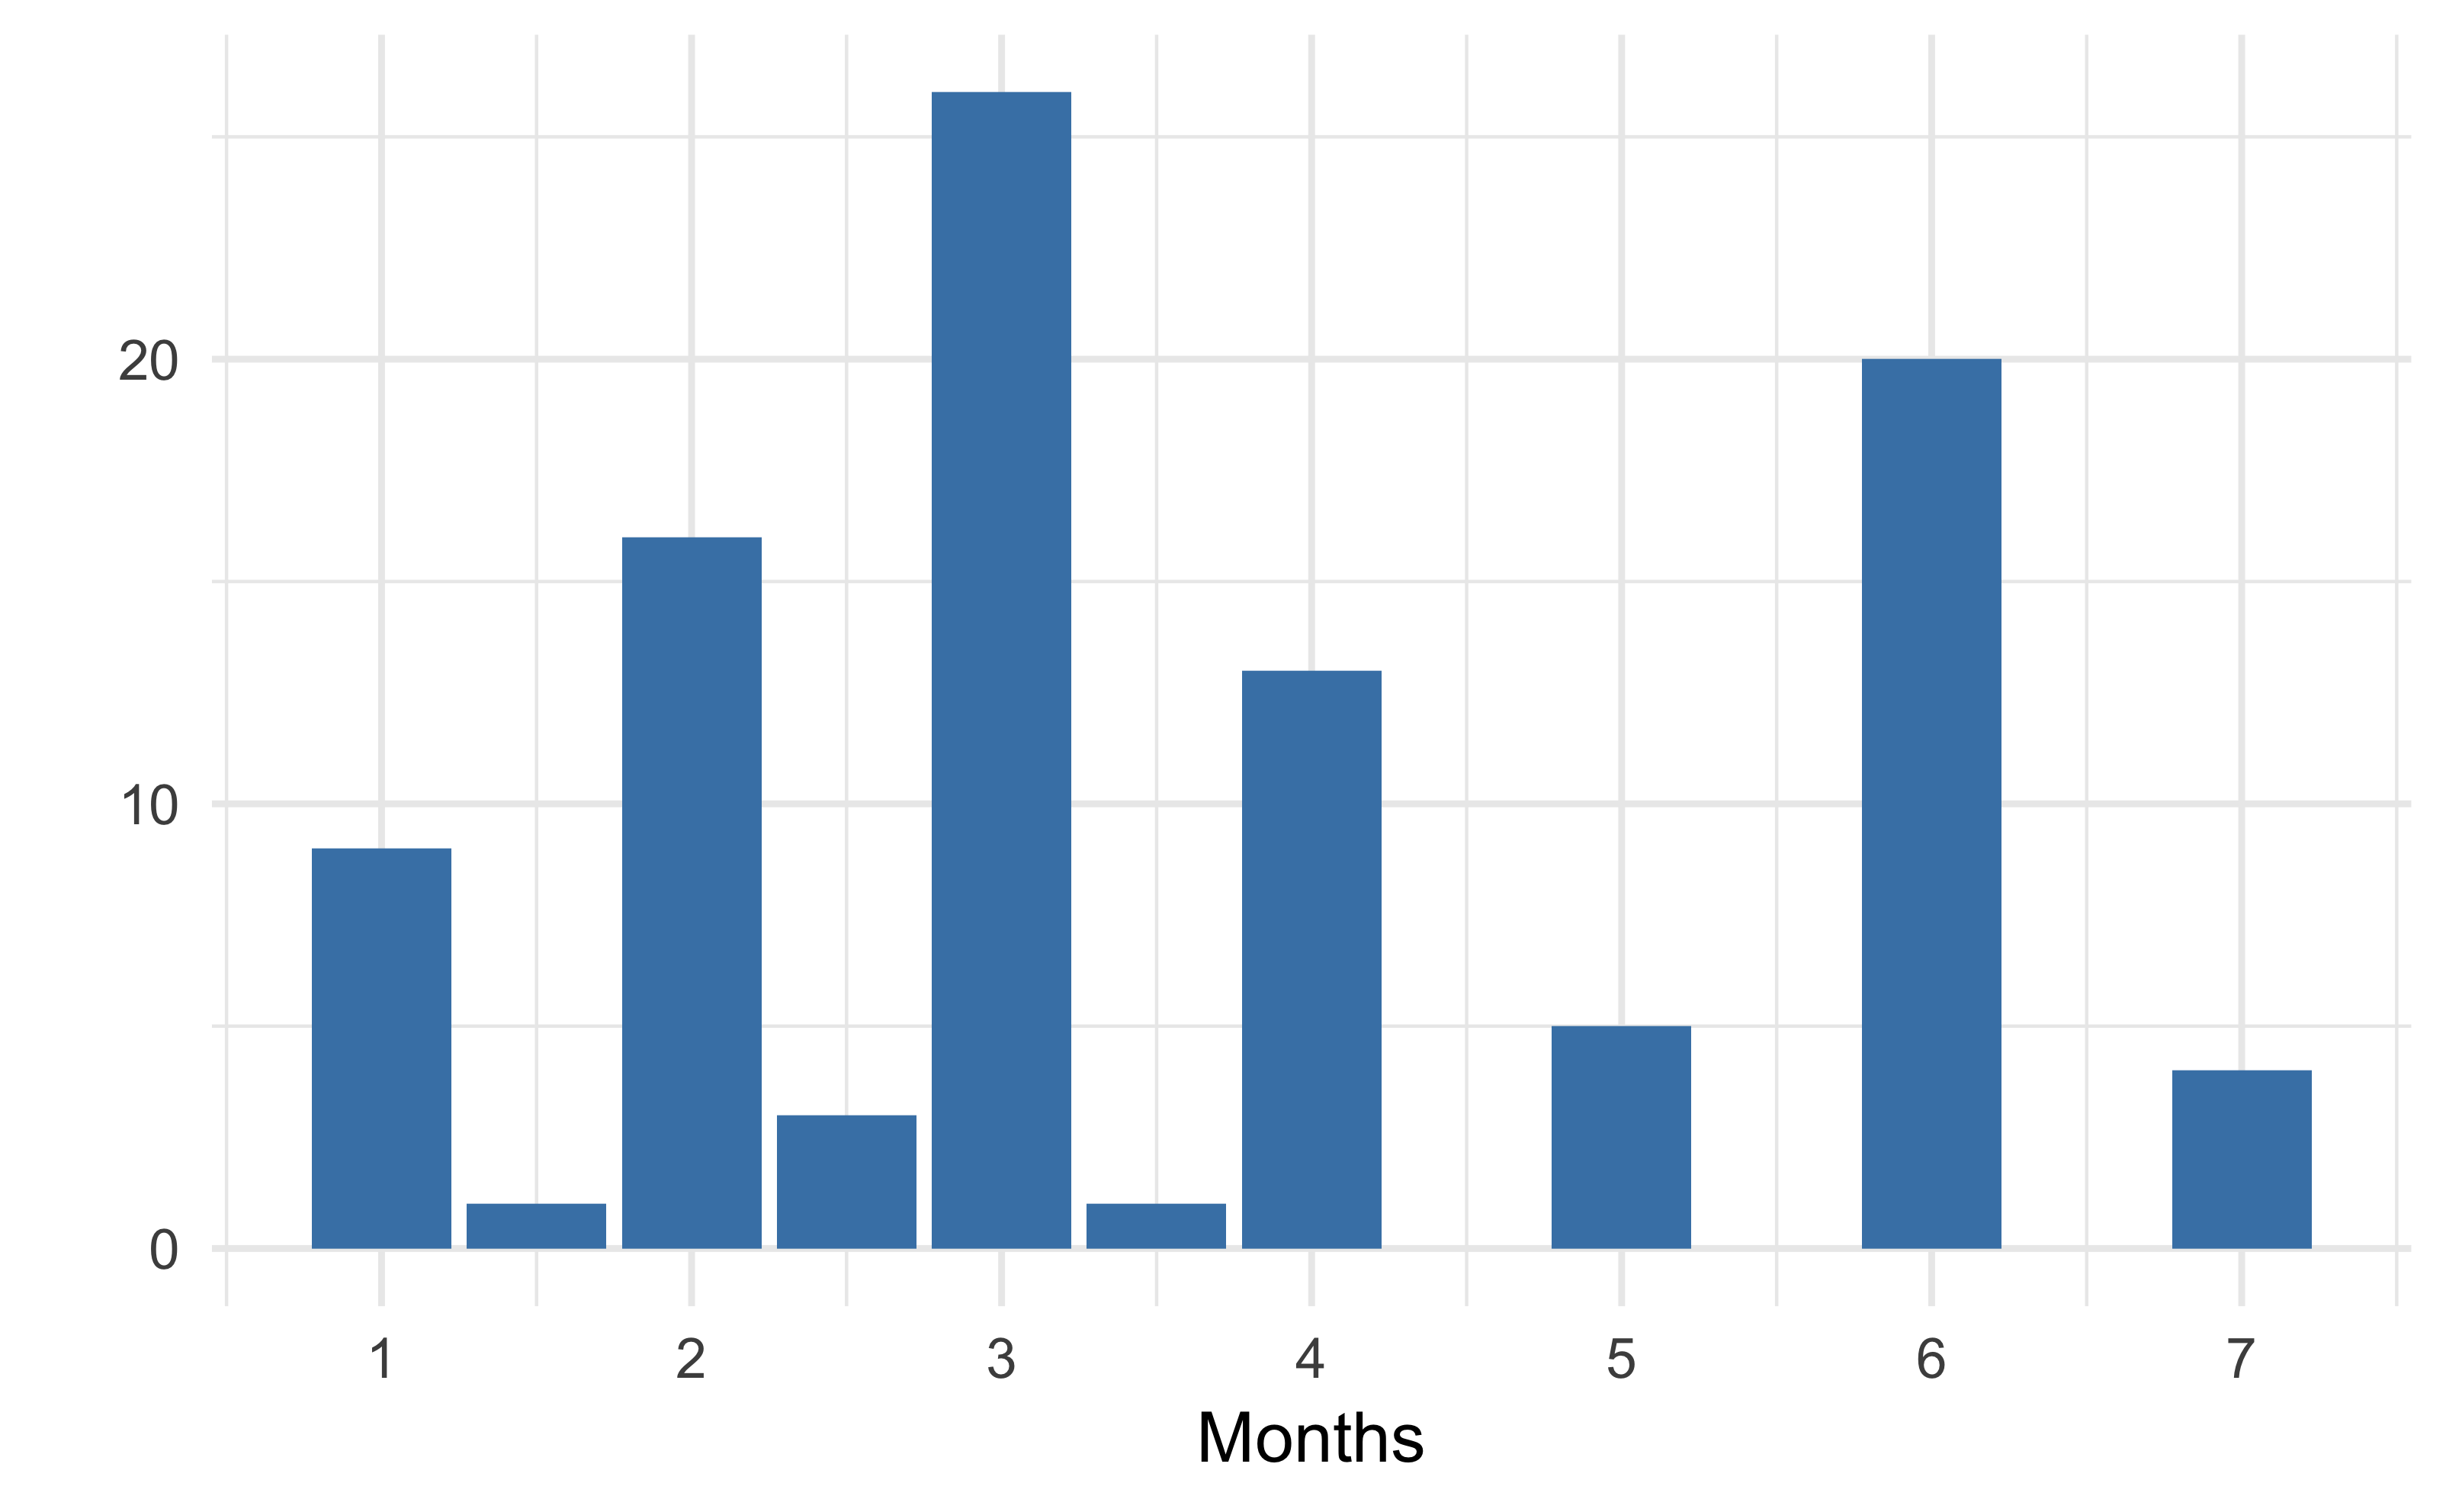
Well, there you have it. The median use time seems to be just 3 months (and the average time only 3.6 months), so I guess it’s a pass from us for now.